
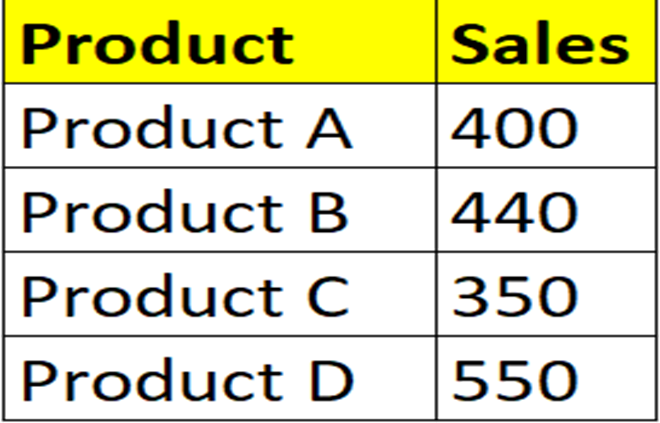
Step 1: Enter the data shown in the example image below for understanding
Step 2 :
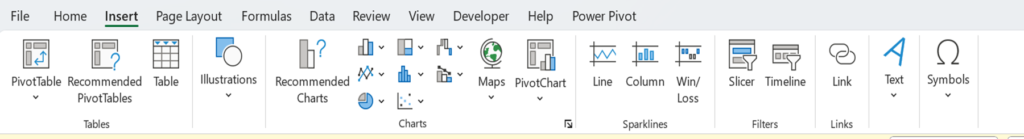
•Click on the previously entered data in either the ‘Product’ or ‘Sales’ column. You can click on any cell within this table.
•Next, click on the Insert tab in the top menu, as shown in the image.
Step 3 :
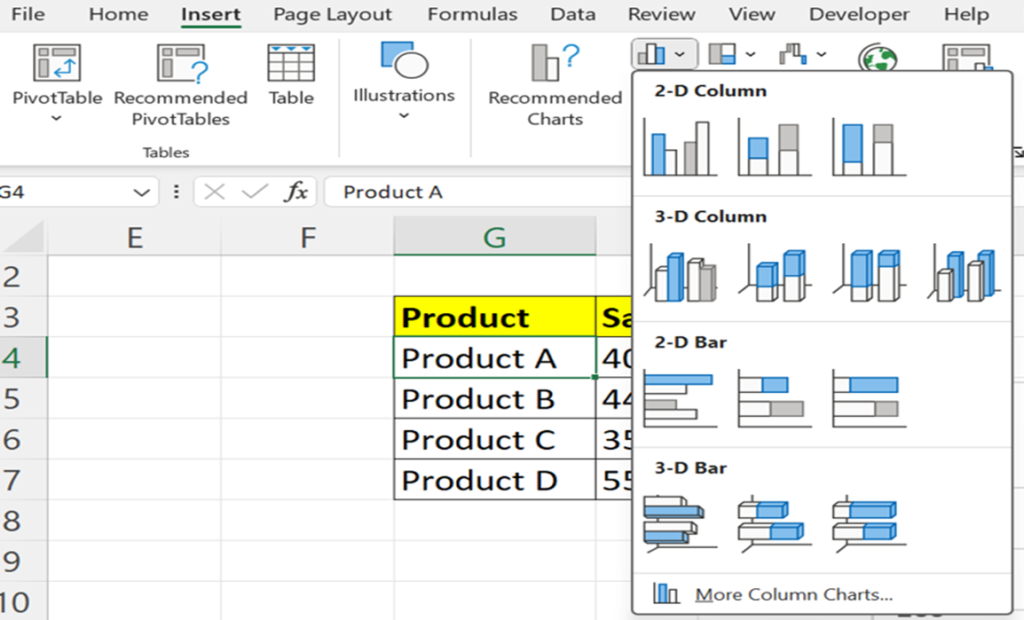
In the Insert tab, click on the Column or Bar Chart option, as shown in the figure. From the dropdown, select the Column Chart to create your chart.
Step 4:
After clicking the Column Chart option, you will see your column chart created on the worksheet.